
Written by Ryan McGuine //
Every June, BP releases its annual benchmark publication, the 2019 Statistical Review of World Energy, which details trends in energy production and consumption over the course of the previous year. Interested readers can see summaries of past Statistical Reviews for comparison.
The year 2018 was another disappointing one as far as the “energy transition” — that is, the shift toward an energy system that emits less greenhouse gases than the current one — at a time when social consciousness around the issue seems to be growing. Globally, carbon emissions from energy use grew at a faster rate than the previous year, at 2% compared to 1.6% in 2017. This growth in carbon emissions is a direct result of the growth in global energy demand, which grew at its fastest rate since 2010 at 2.9%. Approximately two-thirds of this growth can be attributed to energy demand in America, China, and India combined. Of that group, America is the outlier, in that China and India have each seen rapidly-increasing energy demand for decades. In contrast, the growth in American energy demand during 2018 was the fastest seen in 30 years, and the first time its increased it all in 10 years.
Historically, economic growth and energy prices have been sufficient to explain the direction of energy demand. The year 2018 saw slow global economic growth and high energy prices, suggesting that energy demand would be low. However, two forces acted to drive up global energy demand. One driving force behind the spike in energy demand was the number of extreme weather events. During 2018, the USA, China, and Russia — all large energy consuming-countries — experienced more very hot and very cold days than recent years, driving up the use of electricity for air conditioning and natural gas and heating oil for heating. The other major factor in the high energy demand was an uptick in growth by some of China’s most energy-intensive industries like iron, steel, and cement. These sectors had experienced weak growth during the period 2014-17, but began to recover some of those losses in 2018.
Insofar as the large number of extreme weather events are an anomaly, the emissions growth may be less dire than it appears. However, while it is not possible to attribute the strength of any individual weather event to climate change, it is possible to attribute the trend in more dramatic events to climate change. Thus, if 2018’s extreme weather is related to climate change, this could suggest a feedback loop whereby extreme weather drives up energy demand, and the high energy demand drives up carbon emissions.
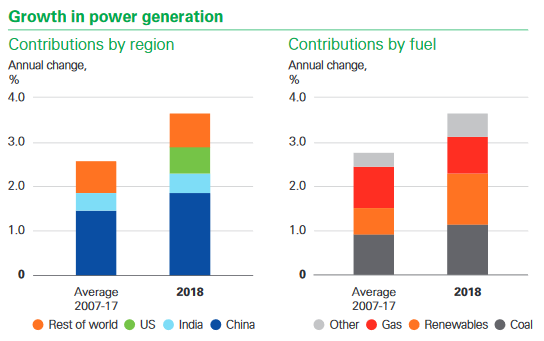
The power sector, the largest single market for primary energy, grew by 3.7% in 2018. In order to generate that new power, renewables grew by 14.5%, coal grew by 3.0%, and natural gas grew by 3.9%, each accounting for about one-third of the generation growth. China installed the most renewable generation of any country to account for 45% of the renewables installed globally in 2018 — more than was installed by the entire OECD, a group of 36 mostly rich countries. While this certainly is a clean tech feat, China should be thought of as a country rapidly installing all types of generation, not one actively pushing sustainability. It also led the world in the construction of coal-fired generation.
Source: BP (2019), Statistical Review of World Energy
One major take-away from the electricity data is that despite the impressive growth in renewables, that growth is off a small base. There is often talk of “decarbonizing” the electricity grid, but they are still unable to provide the entirety of each year’s new generation, never mind displacing existing generation. The pace of global power demand has been so breakneck, particularly in developing Asia, that renewables literally have not been able to be installed fast enough. This is one challenge with achieving emissions reductions targets. For the time being, non-renewables will likely play a role in mitigating emissions — power sector carbon emissions could have been kept constant between 2015-2018 by either installing renewables twice as fast as they actually were during that period, or by switching 10% of all coal generation to natural gas.
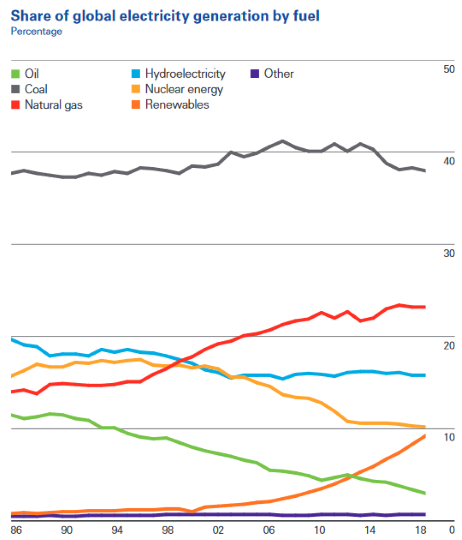
Another take-away is that the global share of coal use in electricity generation remains unchanged over the past 20 years, as shown below. Despite the fact that the share of generation from coal remains the same, much more power is generated today than 20 years ago, so much more coal is burned today than 20 years ago. This is a concern because what matters for climate change is absolute emissions. Of course, coal consumption varies by region of the world. While it is rare to build a new coal-fired power plant in much of the developed West, it remains an attractive option for developing countries that are hungry for cheap electricity.
Source: BP (2019), Statistical Review of World Energy
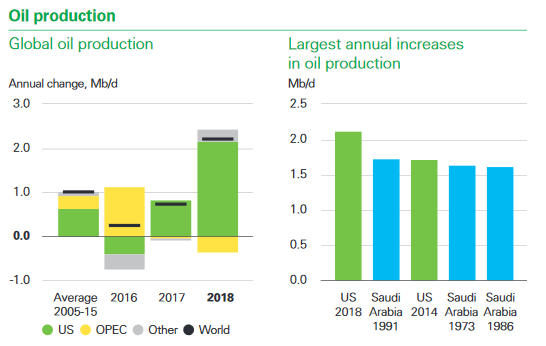
Oil demand increased by 1.4m barrels/day (b/d) in 2018. China and India both predictably saw large demand growth, together accounting for roughly two-thirds of total global growth, while America surprised with its largest increase in over 10 years. Most of the consumption growth in America was not by transportation, but rather as a feedstock for chemical manufacturing. Global oil supply increased of more than double the historical average at 2.2m b/d. This was driven almost entirely by America, which achieved the largest-ever increase by a country in a single year, mostly through tight oil production. Meanwhile, OPEC production decreased by 0.3m b/d, but performance varied by country — Saudi Arabian production increased by 0.4m b/d, Venezuelan production fell by 0.6m b/d, and Iranian production fell by 0.3m b/d.
Source: BP (2019), Statistical Review of World Energy
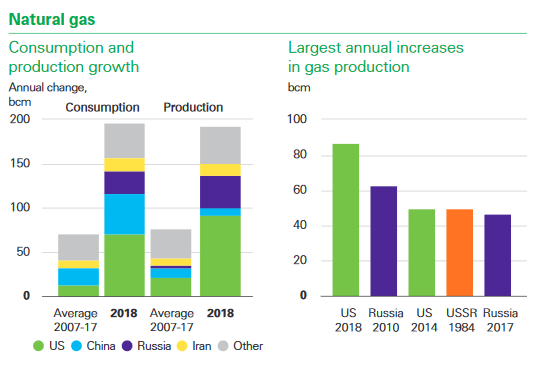
Global natural gas demand and production both experienced their fastest growth in over 30 years. America accounted for around 40% of the demand increase at 78 billion cubic meters (bcm), and 45% of the production increase at 86 bcm. Tight oil formations typically contain natural gas in addition to crude oil, so the same drilling boom that drove America’s oil boom has driven its gas boom. Most of the gas was used domestically to meet the energy demands related to the extreme weather — to generate electricity for air conditioning in the summer, and as a space heating fuel in the winter — but some was exported via America’s new liquefied natural gas (LNG) trains. China also saw very strong demand growth at 43 bcm, thanks largely to environmental policies aimed at switching from coal to natural gas for residential and industrial uses to combat local ambient air pollution.
Source: BP (2019), Statistical Review of World Energy
For the second year, the Statistical Review included data on what it calls “key minerals for the energy transition” — minerals that are used extensively in the manufacture of renewable energy technology. For example, cobalt and lithium are used in batteries for EVs and grid-scale electricity storage, silicon is used in solar panels, and rare earth metals are used in magnets for wind turbines. Production of both lithium and cobalt exceeded their ten-year average growth rates, and prices for both reached levels not seen in decades.
One area to pay attention to is the way that large changes to energy production are shifting geopolitical relationships. In the past, OPEC countries have had the ability to adjust world oil markets as they chose, and Europe depended on Russia for natural gas imports. Today however, booming crude oil production in America gives OPEC much less ability to raise prices through coordinated production cuts, while US gas production allows its allies to import LNG from across the ocean, rather than import gas via pipeline from a hostile neighbor. Beyond fossil fuels, many of the largest reserves of crucial metals are located in countries without a history of resource extraction, potentially creating resource curse situations.
Perhaps the main lesson from this year’s Statistical Review is that there is a growing discrepancy between societal demands for a transition to a lower-carbon energy system, and concrete action by politicians and business leaders. There is little chance of meeting the targets of the Paris Agreement under the status quo. Economic growth and simultaneous declining carbon emissions are not antithetical, but absent policies to motivate carbon emissions reductions, emissions and economic growth are likely to move in unison. A smart policy framework can help achieve meaningful reductions, and citizens should maintain pressure on leaders to pursue one.