
Written by Ryan McGuine //
Every June, BP releases its annual benchmark publication, the Statistical Review of World Energy, which details trends in energy production and consumption over the course of the previous year. Since the report is backward-looking, this year’s does not include data reflecting the impacts of COVID-19 lockdowns. Interested readers can see summaries of past Statistical Reviews for comparison.
This Statistical Review comes with two interesting bits of metrology. First, BP reports energy consumption in units of exajoules, a standard metric unit. For the past 68 years, BP used million tonnes of oil equivalent (mtoe), or the amount of energy contained in one million metric tons of crude oil (one exajoule is roughly equivalent to 24 mtoe, for those keeping track). While mtoe is a fine unit to measure primary energy production, crude oil does not have any end uses itself, so exajoules is a better measure of how much energy actually gets used. Second, whereas BP used to assume a fixed thermal efficiency for fossil power stations to calculate the power generated by non-fossil resources, that value will now rise each year. Burning fossil primary energy to do something generates a huge amount of waste heat, so a conversion is needed to equate non-fossil fuel outputs into primary energy inputs. The new methodology reflects the fact that the global fleet of fossil power stations is becoming ever-more efficient as natural gas combined cycle power stations, which have much lower heat rates than coal-fired power stations, continue to displace coal units.
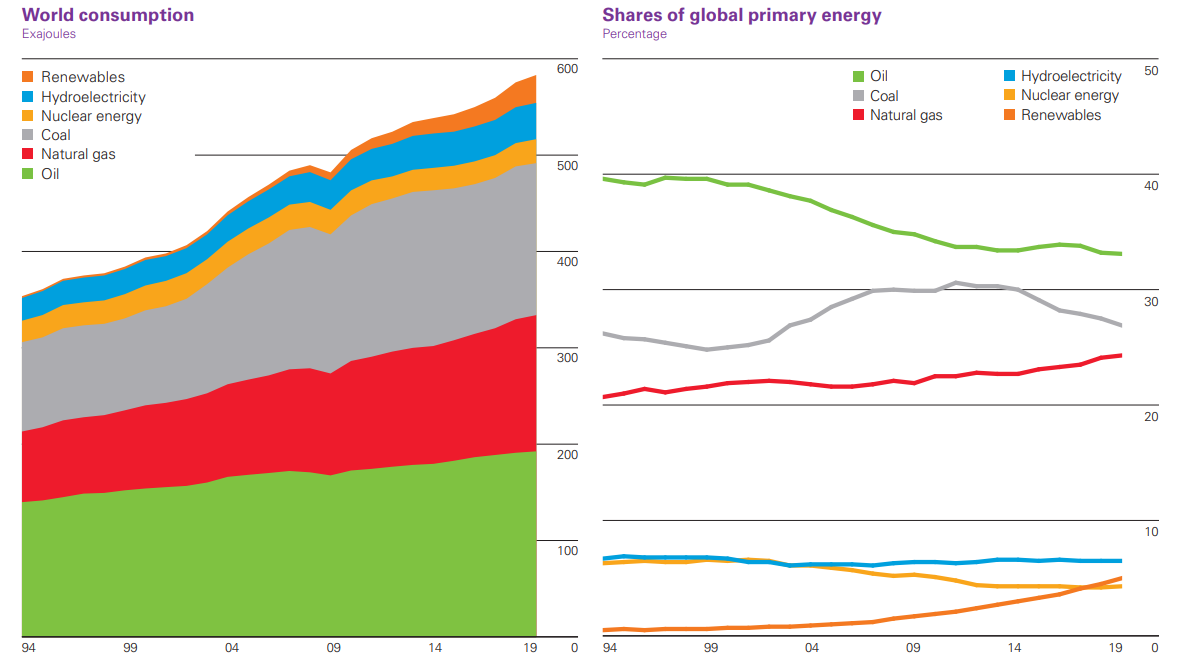
The year 2019 was a mixed bag as far as the transition toward a lower-carbon energy system. Globally, carbon emissions from energy use grew at 0.5%, less half its ten-year average of 1.1%, and much less 2018’s growth of 2%. Growth of global energy consumption was 1.3% in 2019, compared to 2.8% in 2018, and three-quarters of new demand was supplied by natural gas and renewables. China alone accounted for three-quarters of new energy in 2019, and India and Indonesia also saw large growth, while energy consumption in America and Germany declined. It is promising that emissions grew less than energy consumption, but disappointing that emissions are still growing.
Two factors — economic growth and energy prices — have historically been sufficient to explain most of the movement in energy demand. In 2019, global economic growth was slow, while energy prices were low. Typically, high economic growth and low energy prices drive up energy consumption, but these factors are not independent. For example, by 2019 the world had experienced a long economic expansion and was likely reaching the end of a business cycle, so it could be that energy prices were low because economic growth was slow. Energy demand was high in sectors that respond quickly to incremental price changes like the steel and cement industries in China, as well as America’s oil refining. Some long-term structural factors acted to reduce the world’s carbon intensity (the amount of carbon dioxide emitted per unit of GDP), making it possible for energy consumption to grow faster than carbon emissions. These include strong growth in renewable energy power generation, strong growth in natural gas power generation, and energy efficiency gains across all sectors.
The power sector, the largest single market for primary energy, and the leading source of greenhouse gas emissions in most countries, grew by just 1.3% in 2019, about half of its ten-year average. The share of global electricity generated by renewables (which BP counts as biofuels, plus electricity from sources other than coal, natural gas, nuclear, or hydro) grew from 9.3% to 10.4%, natural gas also grew to 23.3%, and coal declined by 1.5% to 36.4%. One promising trend: non-fossil power generation (renewables, hydroelectricity, and nuclear) together generated about as much electricity as coal-fired power stations in 2019. Growth of electricity consumption is a good thing across the board — increased consumption in poor countries is important for well-being there, and electrifying as many applications as possible in wealthy economies plays a key role in their decarbonization.
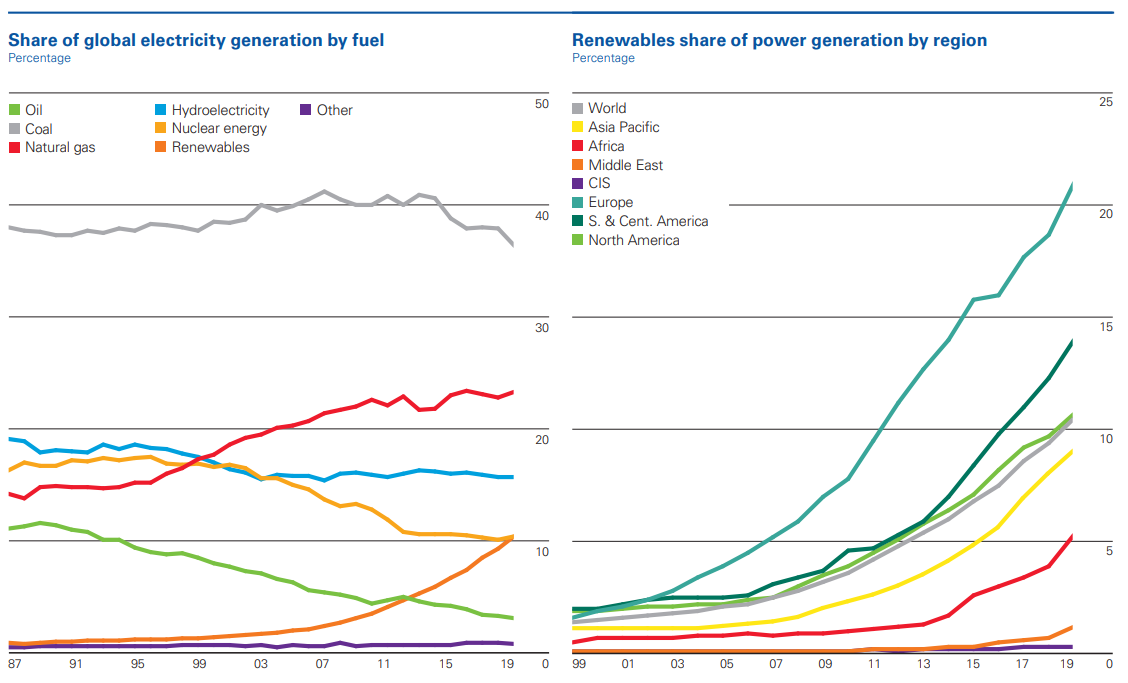
Renewables grew by 41% in 2019, more than any other primary energy source. Despite multiple years of double-digit growth, it is important to remember that the growth is off a small base. Further, renewables are predominantly available to the power sector. The power sector is relatively easy to decarbonize today, because the technology to do so — wind turbines, solar panels, battery storage, etc — is already well-developed, and because the sector is responsive to relative fuel pricing. Sectors like aviation and shipping transportation, industrial and building heat, synthetic fertilizers, and petrochemicals have almost no viable alternatives, so while renewables made up 10% of global power generation in 2019, they accounted for just 5% of total primary energy consumption.
The global share of coal use in electricity generation has remained nearly unchanged over the past 20 years. In 2019 coal fell to 36.4% of global power generation, which is its lowest since 1985. However, coal remains the largest single source of electricity generation, and even though coal’s share of generation has fallen, more electricity is generated today than 20 years ago, so much more coal is burned today. While few new coal-fired power stations are being built in the developed West, it remains an attractive option for developing countries that are hungry for cheap electricity like China, India, Indonesia, and Vietnam. The vast majority of coal consumed is “thermal coal,” which gets burned for power generation, as well as and paper and cement manufacturing. A smaller fraction of coal is “metallurgical coal,” which gets turned into coke to produce steel, and some is used in stoves and furnaces.
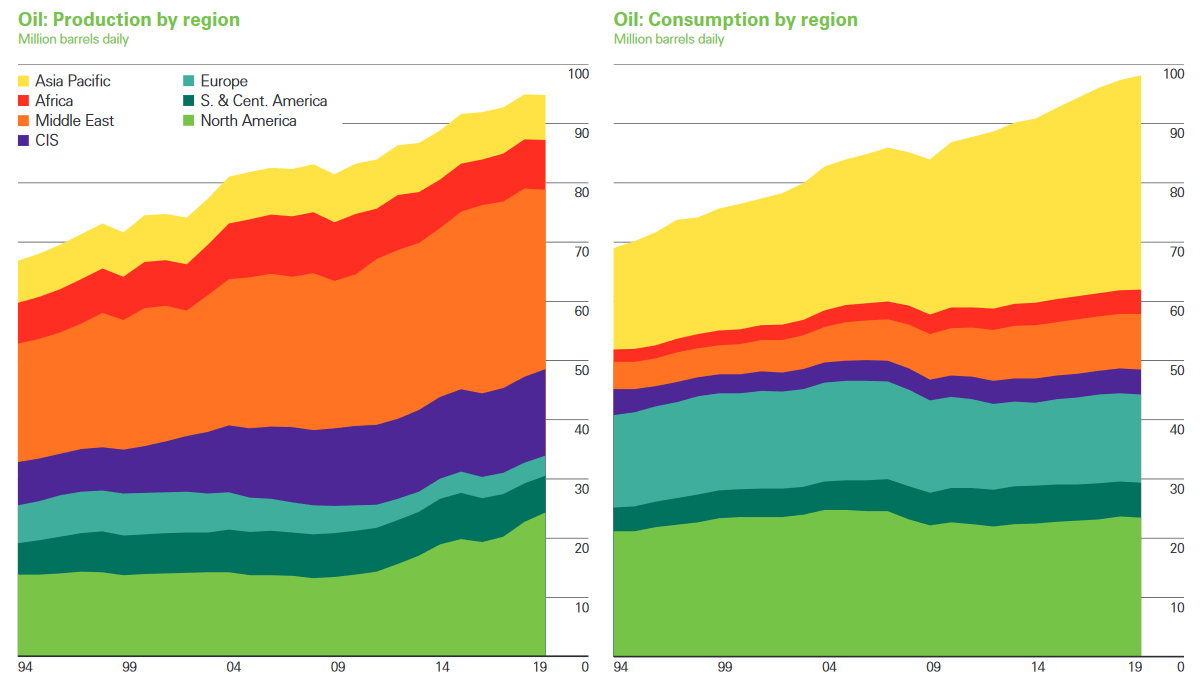
Global oil consumption increased by 0.9m barrels/day (b/d) in 2019. China posted the largest growth of any country at 680,000 b/d, while consumption fell for the first time since 2014 in the OECD, a club of 36 mostly rich countries, by 290,000 b/d. On the well side, total production was down 60,000 b/d in 2019. For the third consecutive year, America outpaced all other countries, growing output by 1.7m b/d, while Brazil and Canada also saw large increases. OPEC experienced its steepest production decline since 2009, falling by 2m b/d, due partly to sanctions and economic troubles in Iran and Venezuela, as well as ongoing OPEC production cuts. Crude oil is refined into a wide range of petroleum products, including motor gasoline, fuel oil, jet fuel, and hydrocarbon gas liquids, which are used in the industrial sector as feedstocks for chemicals, plastics, and asphalt. In 2019, substitution of liquefied petroleum gas for naptha in petrochemicals saw demand rise for the former and fall for the latter, and a similar see-saw effect was seen by maritime diesel and high-sulfur bunker oil, as the International Maritime Organization’s sulfur specification took effect.
Global natural gas consumption grew by 2%, or 78 billion cubic meters (bcm), which is slower than both its its ten-year average, and the previous year’s growth. Natural gas consumption increases with more extreme weather (it is used to generate electricity for air conditioning in the summer, and as fuel for space heating in the winter), and consumption in China, the USA, and Russia was down in 2019 compared to 2018 thanks to milder weather. Further, China pursued aggressive coal-to-gas switching programs throughout 2018, but did less of it in 2019. Natural gas production outgrew consumption, increasing by 3.4% in 2019. America contributed almost two-thirds of that growth with 85 bcm, and Australia and China both also grew significantly with 23 bcm and 16 bcm respectively.
The Statistical Review also includes data on what it calls “key minerals for the energy transition.” Today, most energy that gets consumed is in the form of fossil fuels, which must first be extracted from the ground. However, the energy transition requires a large buildout of clean energy assets, and those technologies depend on a range of minerals — cobalt and lithium are used in batteries for EVs and grid-scale electricity storage, silicon is used in solar panels, and rare earth metals are used in magnets for wind turbines. As such, the energy transition is better conceptualized as a shift toward the extraction of different resources, not the extraction of fewer. After large jumps in the production of lithium and cobalt, these values declined in 2019. At the same time, extraction of graphite and rare earth elements saw strong growth.
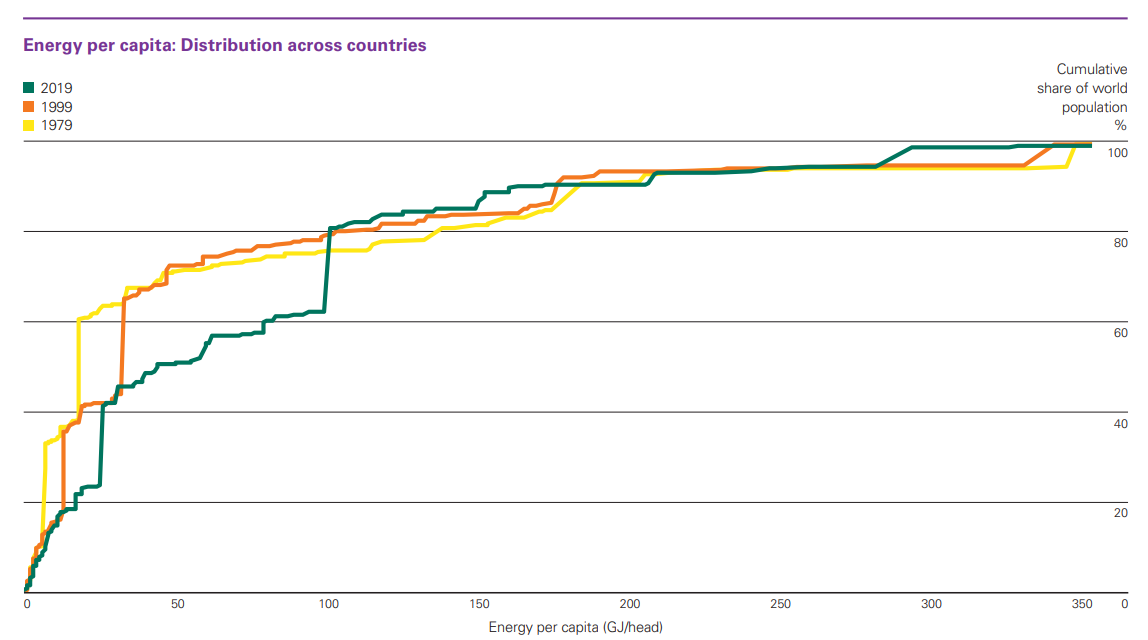
Energy consumption per person has increased a lot in the last 40 years. As shown below, whereas 60% of the world’s population consumed at least 20 GJ of energy in 1979, that same portion consumed about 35 GJ in 1999 and 100 GJ today. Higher energy consumption is associated with higher incomes, so this trend should be celebrated. Where that new energy comes from matters a great deal to the climate, but the idea that global decarbonization requires preventing low-income countries from using fossil fuels should be rejected. Low-income countries should continue building low-cost energy infrastructure, while high-income countries should lead the world in clean energy innovation and deployment of new technology.
The main lesson from this year’s Statistical Review is that there is that there have been some steps in the right direction, but that trend needs to continue, and indeed accelerate, to prevent serious climate impacts. Climate change is a “stocks” problem rather than a “flows” one — that is, it is a function of the total accumulated greenhouse gases in the atmosphere, not how much is entering at any given point. Government efforts to mitigate the economic effects of COVID-19 provide a massive opportunity to invest in a high-energy, low-carbon future. However, even if countries do enact green stimulus measures, they alone will not be enough to make a lasting impact on greenhouse gas emissions. Only legislation that fosters structural changes to the way humans live can do that.