
Written by Ryan McGuine //
Every summer, BP releases its annual benchmark publication, the Statistical Review of World Energy, which details trends in energy production and consumption over the course of the previous year. The report is backward-looking, so this year’s report includes data reflecting the impacts of COVID-19 lockdowns. Interested readers can see summaries of past Statistical Reviews for comparison.
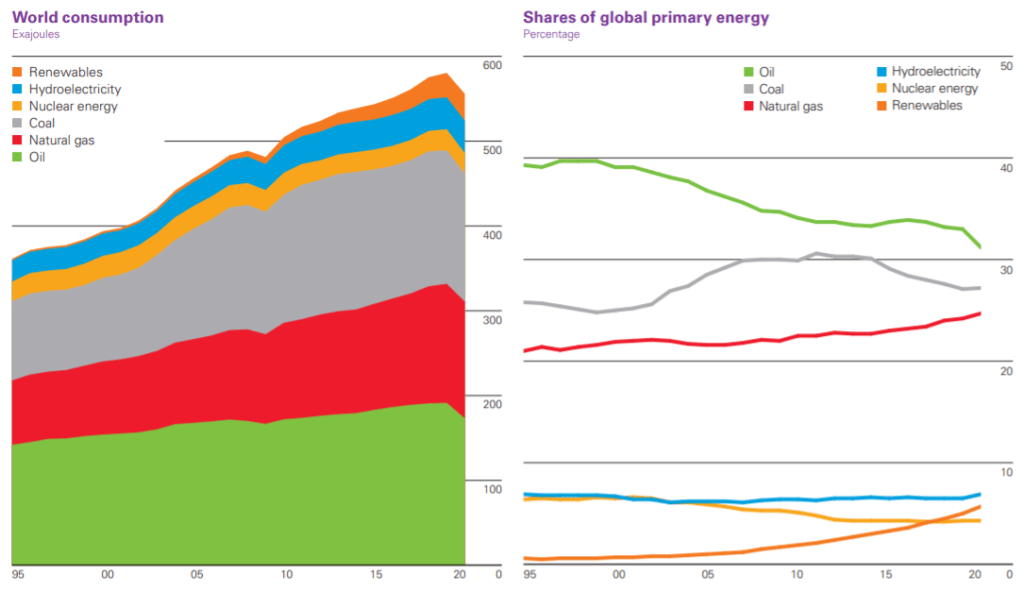
Looking back in time since BP began publishing their Statistical Review in 1951, quite a lot has changed. Today’s energy mix, and the methods used to measure it, are quite different than they were 70 years ago. However, things are usually fairly similar from one year to the next: carbon emissions usually tick up by a few percent, and consumption of each energy source may move up or down by a few percent. Using the word “unprecedented” to describe 2020 is almost a cliché — nearly every chart from the year has at least one glaring discontinuity — but in terms of energy, the word is only fitting. During 2020, primary energy consumption and carbon emissions both saw their largest year-to-year drops since 1945, at 4.5% and 6.3% respectively. That brought global carbon emissions down to roughly 2011 levels. The carbon intensity of the energy mix, the amount of carbon dioxide emitted per unit of GDP, fell by 1.8%. World GDP fell by 3.5%, and China was the only country whose economy grew significantly in 2020, as well as the only country to see significant energy consumption growth.
At first glance, 2020 may appear like a good year for the transition toward a lower-carbon energy system, but the declines in energy usage and carbon intensity that drove the drop in carbon emissions can be tied to the COVID-19 lockdowns. About two-thirds of the emissions reduction seen was due to lower energy consumption, while the last third can be attributed to the drop in carbon intensity, and about three-quarters of the drop in energy consumption was due to the crisis, while the last quarter can be attributed to structural factors. For context, if the world achieved the same rate of emissions reductions every year for the next 30 years, it would get about 85% of the way to net-zero by 2050. This would most likely result in less than 2°C of temperature rise above pre-industrial levels, but more than 1.5°C. However, a shrinking global economy and 4m deaths is not an enticing path to future emissions reductions. Instead, the goal should be to reduce long-term emissions by making structural changes to the way humans live.
Historically, just three factors — economic growth, energy prices, and the number of unusually hot and cold days — have been sufficient to explain most of the single-year movement in primary energy demand. While these factors predicted the basic movements in energy demand throughout the year, actual demand declined by almost twice as much as these factors predicted. This misalignment with the model was almost exclusively due to the collapse in oil demand, which was responsible for three-quarters of the total reduction in energy consumption. It is interesting to investigate why oil demand was hit so strongly compared to other energy sources. As it turns out, the pandemic had vastly different impacts on different parts of the economy. The year saw contractions in business activity and personal consumption in line with other downturns, but 2020 stood apart in its large reduction in transportation due to government-imposed lockdowns. This led to a 40% decline in jet fuel use, and a 13% decline in gasoline use. Natural gas had fallen in line with 2009, reflecting less industrial consumption, while power actually declined less than expected, thanks to the fact that lower usage by industrial and commercial customers was partially replaced by higher residential usage.
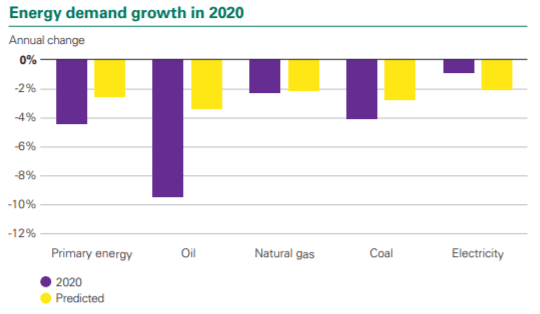
The power sector, the largest single market for primary energy, and the leading source of greenhouse gas emissions in most countries, experienced the smallest decline among the components of final energy demand. Electricity consumption fell by just 0.9% in 2020, as employees and students spent more time at home. Renewables (which BP counts as biofuels, plus electricity from sources other than coal, natural gas, nuclear, or hydro) have accounted for over 60% of total global power generation growth in the last 5 years, and recorded their biggest year ever in 2020. The share of global electricity generated by renewables grew from 10.4% to 11.7%, natural gas remained constant for about 23.4%, and coal shrank 1.3 percentage points to 35.1%. The growth of renewables in power generation is good news because decarbonizing electricity makes it possible to reduce the carbon intensity of many other processes.
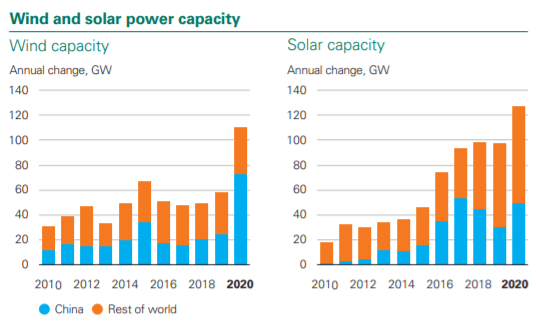
Despite huge disruptions to the global economy and collapses in other energy markets, renewables had a banner year. A total of 238 gigawatts (GW) of wind and solar capacity was installed around the world, more than any prior year-on-year addition. Almost half of the capacity installations occurred in China, but the country is better conceptualized as one rapidly installing all types of generation, rather than one focused exclusively on sustainability. Zooming out, wind and solar capacity more than doubled between 2015 and 2020, growing about 18% annually, thanks to impressive cost declines. That is roughly the rate needed to remain on track for Paris Agreement commitments, but a few caveats are in order. First, as renewables make up a larger portion of power grids around the world, it becomes more expensive to continue adding even more. Second, most primary energy sources are not perfect substitutes for one another, and numerous sectors lack viable alternatives to fossil fuels today. This is why coal and natural gas use continue to rise even though wind and solar are the cheapest forms of energy available. It is also why the energy transition requires more than one set of solutions — technologies like hydrogen, energy efficiency, long-duration energy storage, and carbon capture will all be necessary for different applications.
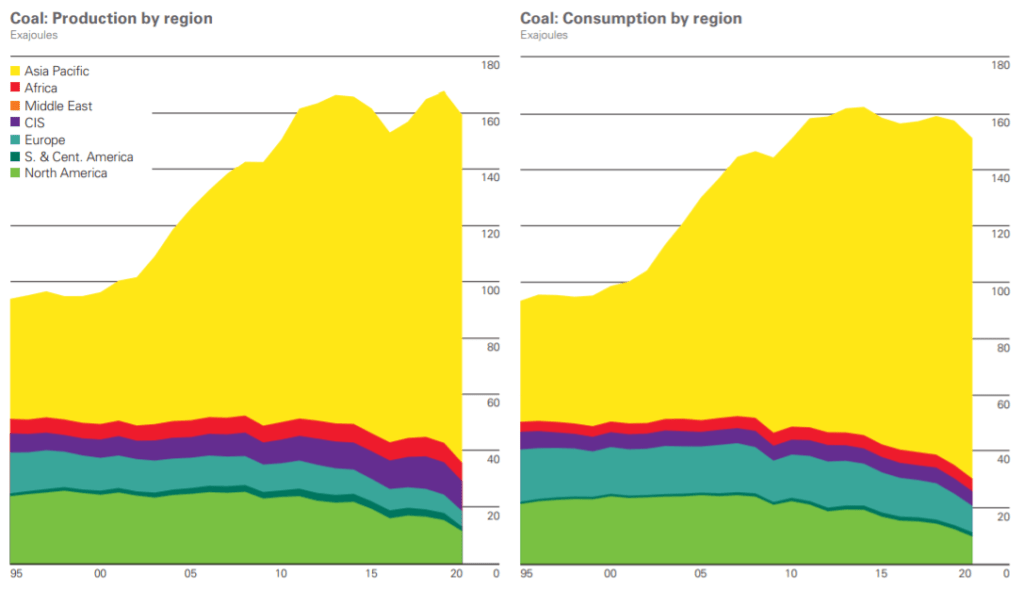
Global coal use fell by 6.2 exajoules (EJ) in 2020, or 4.2%, led by declines of 2.1 EJ in America and 1.1 EJ in India, and despite consumption increases in China and Malaysia by 0.5 EJ and 0.2 EJ respectively. The global share of coal use in electricity generation remained nearly unchanged over most of the past 20 years, but its share has declined during each of the last two years. Coal made up 37.8% of global power generation in 2018, but after 2020, it has declined to 2015 levels. Historically, all energy transitions have consisted of adding additional resources to the energy mix, rather than replacing existing resources. The fact that coal has declined for two consecutive years suggests some coal replacement might be occurring, but climate math demands an even faster pace. Coal consumption in the OECD, a club of 36 mostly rich countries, reached its lowest levels since 1965, but it remains attractive to Asian countries hungry for cheap electricity. The majority of coal consumed is “thermal coal,” which gets burned for power generation, while a smaller fraction is “metallurgical coal,” which gets turned into coke to produce steel, and is used in some stoves and furnaces.
Global oil consumption fell off a cliff unlike anything ever seen between January and April of 2020, declining by over 20m barrels per day (b/d). At the same time, Saudi Arabia and Russia fought a brief price war, both seeking to out-produce the other. These events combined to rapidly drive up inventories, and rapidly drive down prices. However, OPEC+ agreed to cut production in April, and reduced output by 9.7m b/d between May and July, while the US followed suite to the tune of 4m b/d. As lockdowns began easing in the summer, supply and demand were brought closer together. Oil prices moved steadily upward, and continued OPEC+ constraint kept supply below demand, eliminating about half of the excess stocks that had accumulated earlier in the year. In the face of a shock, a group like OPEC, which has the ability to cheaply ramp production up or down, has to make trade-offs between increasing their market share but lowering prices, and losing market share but stabilizing prices. During 2020, OPEC+ opted for the latter, but longer term, it is unclear how the decisions and incentives of individual member countries will change in response to decades of declining oil demand. Global production in 2020 was led by America, Saudi Arabia, and Russia, and ended the year at 4165.1 million tonnes, down from 4478.0 million tonnes in 2019.
Natural gas usage fell by 81 billion cubic meters (bcm), or 2.3%, but still grew in terms of the share of primary energy consumption, accounting for 24.7% of all energy used. Consumption declines were largest in Russia and the USA, with drops of 33 bcm and 17 bcm respectively, while increases were led by China and Iran, with gains of 22 bcm and 10 bcm. Supply of liquefied natural gas (LNG) was essentially flat during 2020, rising just 0.6%, which is far below the 10-year average of 6.8%. Natural gas is commonly used in combustion turbines to generate electricity, burned for space heating, or burned for high-temperature heat in industrial applications. When combusted completely, it produces far less local air pollution, as well as fewer greenhouse gases. Interestingly, Russia’s Gazprom plays an analogous role in European natural gas markets to OPEC in global oil markets — they constantly balance providing excess gas to take market share from imports of American LNG, and reducing supply to keep price levels high. It appears that Gazprom was willing to relinquish some market share to support prices during 2020, but similar to oil, it is unclear how their behavior will change in a world of sustained and growing declines in natural gas demand.
Most energy that gets consumed today is in the form of fossil fuels, which must first be removed from the ground. However, the technologies needed for the transition to a lower-carbon energy system also depend on the extraction of a range of metals and minerals. For example, cobalt and lithium are used in batteries for EVs and grid-scale electricity storage, silicon is used in solar panels, and rare earth metals are used in magnets for wind turbines. As such, the energy transition is better conceptualized as a shift toward the extraction of different resources, not the extraction of fewer. During 2020 lithium production fell 4.6% due to reductions in Australian output, while cobalt production expanded by 2.9%, driven primarily by the Democratic Republic of the Congo. Rare earth elements rose 23.2%, led by output growth in Australia and the USA.
In high-income countries, many governments have responded to the health and economic shocks caused by COVID-19 by spending huge sums to help cushion the blow to citizens, and some allocated a portion of their relief aid to clean energy. America’s Congress signed the Energy Act of 2020 into law, Europe designated 37% of its support package to climate objectives, and multiple other countries have taken similar actions. The measures being considered are so large that they make nearly all pre-pandemic energy initiatives look like peanuts. At the same time, much of the world lacks access to electricity at all, prioritized by the UN as Sustainable Development Goal 7: “Ensure access to affordable, reliable, sustainable, and modern energy for all.” There has been considerable progress on this front, with 250m people gaining access to electricity between 2015 and 2019, bringing the total without access from about 15% of the world’s population to just 10%. But almost 3.5 billion people, or roughly half of the world’s population, consume less than 1,000 kWh of electricity per person per year — the level of consumption necessary to support strong, sustainable economic growth — almost all of whom are situated in India and sub-Saharan Africa. In these countries, the priority should be building out low-cost energy infrastructure as soon as possible, even if that means using more fossil fuels.
In January Ken Caldeira and Ted Nordhaus made a bet over whether annual carbon emissions for any year between 2021 and 2030 will exceed those of 2019. Whether 2020 is indeed the exact year that carbon emissions peak and begin to decline, there is some reason to be optimistic that it is near. Emissions during the last decade have grown more slowly on average than those of the preceding decade, thanks to more low-carbon electricity generation and faster declines in energy intensity of economies. Rhetorically, countries that once argued over who was most to blame for climate change now clamor over one another to be the first to act. At the Paris Convention just 6 years ago — a crucial milestone because it concluded with global alignment on climate targets, and understanding that all countries would do their part to meet them — not one country proposed net-zero targets. Today, ten countries and the European Union have passed net-zero carbon emissions targets into law, 34 countries have proposed legislation or policy goals with the same intent, and actors ranging from asset managers, consumer goods companies, and insurers are actively considering how to reposition themselves for a world where net-zero is the default. There is a good deal of positive momentum, and almost everyone is accelerating their efforts.
Despite such impressive strides, though, it is important to be clear-eyed about the challenges ahead. First, lockdowns artificially held down emissions during 2020. Global carbon emissions are already near their pre-pandemic levels, and going forward, similar annual reductions are needed without shrinking the economy. Second, the climate pledges made to date do not go far enough. Even if all countries met the targets that they formally submitted to the UN, the world would fall short of the goals established by the Paris Agreement. Third, there remains a large gap between actors’ pledges and their actions. No matter how historic the proclamations, only real emissions reductions matter at the end of the day. The good news is that plenty can be done today to help meet rising climate ambitions, including rapidly installing proven technologies like wind and solar power, adopting smart policies to incentivize even more clean energy, and increasing funding from developed to developing countries. Perhaps most crucially, administrative impediments to building out clean energy should be removed. Achieving net-zero by 2050 requires a huge expansion of new stuff, but building infrastructure costs too much in wealthy countries, and environmentalists too often get in their own way. Improving regulatory processes may be less captivating than flashy new technologies, but neglecting the former threatens to derail progress on the latter.
Very impressive, Ryan. It must have taken hours and days of work to put this all together. It seems as if the world is gradually going in the direction of using cleaner energy. And you are definitely one of the pioneers of this movement. Congratulations. Hope to see you soon.
Grandma Shelly
Looking forward, what is your thoughts on the goals that the US government and the major automotive companies are pledging for electric vehicles production and the addition of electric car charging stations in the US. I have heard it could add a 25% demand on power supply to the grid. Do you think it will be as big of an impact on the power sector?
Thanks for your comment! There are a couple considerations. While today’s grid can likely handle on average one EV per household constantly, that’s not how people use electricity. Everyone comes home from work and plugs in their car right away, at the same time they’re turning their lights and AC on, and the same time that solar power is winding down. The cheapest way of solving that problem is probably electricity pricing that varies by demand, or discounted rates to customers who opt in to having energy-intensive appliances turned down when demand is high. That said, there will absolutely need to be an expansion of transmission and generation infrastructure, particularly given how much fossil generation is likely to be phased out simultaneously. I’m optimistic that it’s technically possible, but more worried about the regulatory hurdles to such widespread building.