
Written by Ryan McGuine //
In June, oil supermajor British Petroleum (BP) released its 2018 Statistical Review of World Energy, a summary of the trends observed in the energy industry during the prior year and the economic factors driving those trends. BP’s Statistical Review is published annually and is considered a benchmark for the energy industry.
Lately, there has been a lot of buzz surrounding the current “energy transition,” a term commonly used to refer to the shift toward an energy system that emits less carbon dioxide. During the period 2014-2016, energy demand was lower than historically, energy intensity (the number of energy units consumed per unit of GDP) declined faster than historically, and energy-related carbon emissions grew at a faintly-detectable rate. All good things. This performance was due to a combination of long-term structural factors including strong growth in renewable energy power generation, strong growth in natural gas power generation, and strong energy efficiency gains across all sectors, as well as short-term cyclical factors, notably weak growth in the countries and sectors that consume the most energy like China’s heavy industrial sector.
Compared to the last three years, 2017 was disappointing in terms of the energy transition. Energy consumption increased by 2.2%, the fastest since 2013; energy intensity continued to decline, but at a slower rate than was seen in the last three years; and carbon emissions increased by 1.6% compared to 0.1% in 2016. These data are largely the result of stronger economic growth in developing countries — energy consumption and incomes are closely correlated. Below is a graph of world energy consumption by source.
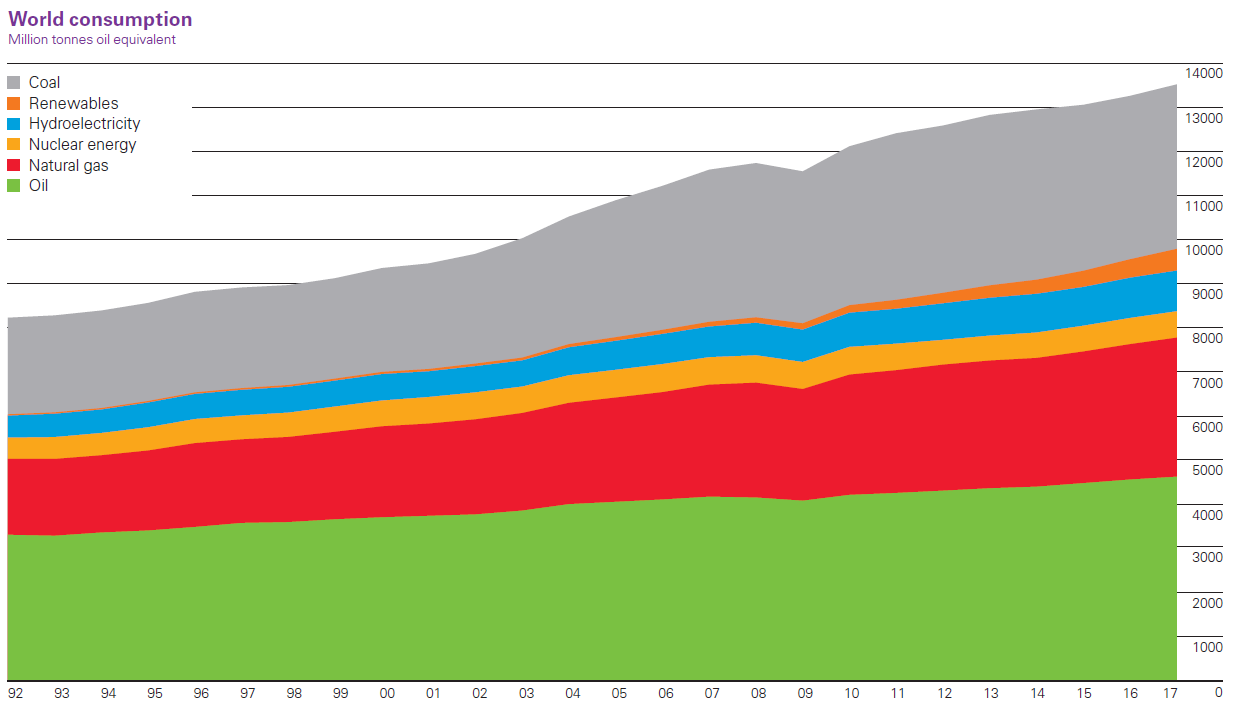 Source: BP (2018), Statistical Review of World Energy
Despite this, there are good reasons not to be discouraged. First, economic growth in developing countries is good for the well-being of citizens. It expands capability sets, since growth is the most effective paths to poverty reduction. In addition, while the cyclical factors that made the last three years exceptional may be over, the structural factors that contributed to the progress continue to affect change — one year’s data does not constitute a trend. Finally, even if 2017 was disappointing, it must be viewed in light of the situation prior to 2014. Averaging carbon emissions for the years 2014-2017 shows growth of just over 0.5% per year, while averaging the years 2003-2013 shows growth of around 2.5% per year. Think of 2017 as the latter part of the phrase “two steps forward, one step back.”
It makes sense to begin with the power sector, since it is the largest single market for energy, accounting for 40% of total primary energy consumed and over a third of all carbon emissions. The power sector fuel mix — the relative composition of primary energy consumed to produce electricity — determines how much carbon is emitted. The good news is that renewable energy grew by 17% in 2017, accounting for roughly half of all new power generation built around the world. Renewables’ high growth is off a small base, though, so they remain a small contributor to total power generation, accounting for about 8%. The bad news is that after three years of declining coal consumption, 2017 saw an increase. In fact, the share of coal in the global power sector fuel mix has not changed over the past 20 years — it was 38% in 1998 and is 38% today, shown below. Since overall power consumption has increased over those 20 years, much more coal is consumed today than was consumed 20 years ago. Coal consumption is important from both a health and climate standpoint because it produces the most local ambient air pollution, as well as the most global ambient air pollution, of any primary energy source.
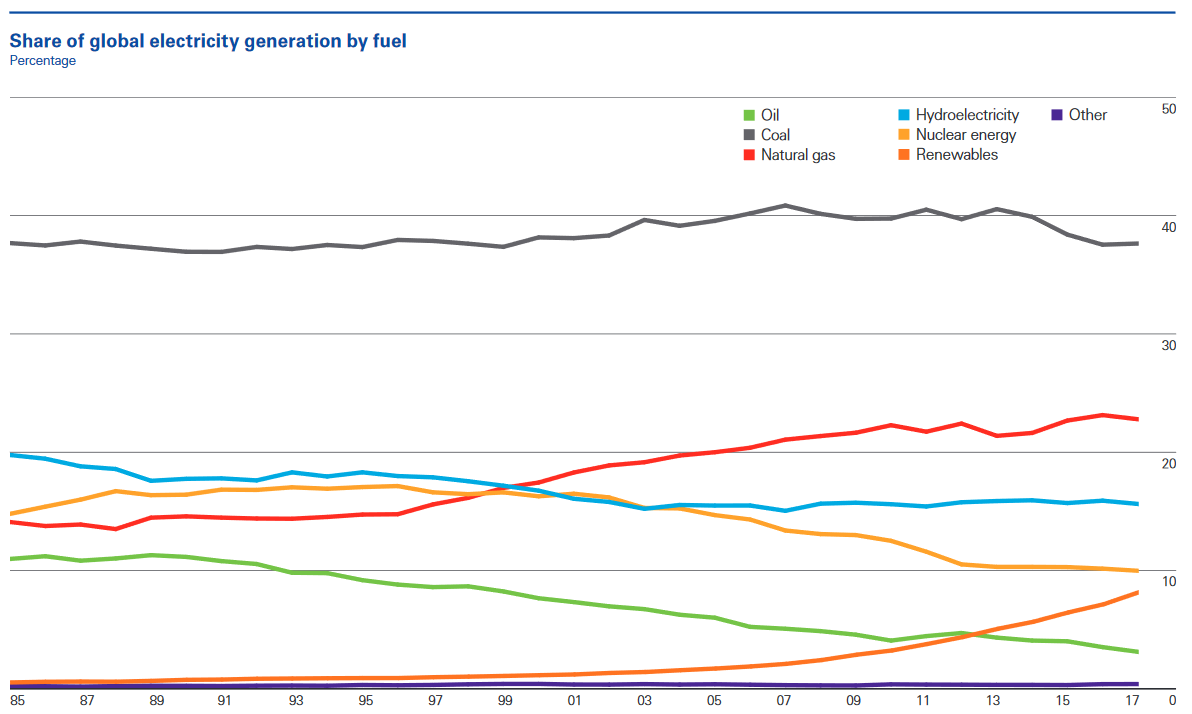 Source: BP (2018), Statistical Review of World Energy
Of course, coal consumption trends differ widely by country. Between the mid-1950s and early-2000s, coal accounted for roughly half of America’s total power generation, but generates just 30% today. England saw its first day without coal-fired generation on the grid since the Industrial Revolution in 2017. As much of the developed West moves away from coal today, developing countries are driving global coal consumption, since despite the declining costs of renewables, coal remains the cheapest fuel in many places. As shown below, India consumed the most coal out of any country in 2017 as it strove to power its rapidly growing economy. Interestingly, China also saw an increase, despite a massive government effort to combat air pollution by replacing coal with natural gas in the industrial and residential sectors. Even though the share of coal in all of China’s sectors declined thanks to increases in natural gas and renewables, absolute coal consumption increased slightly, since coal filled in the gaps of the enormous primary energy demand in the power sector.
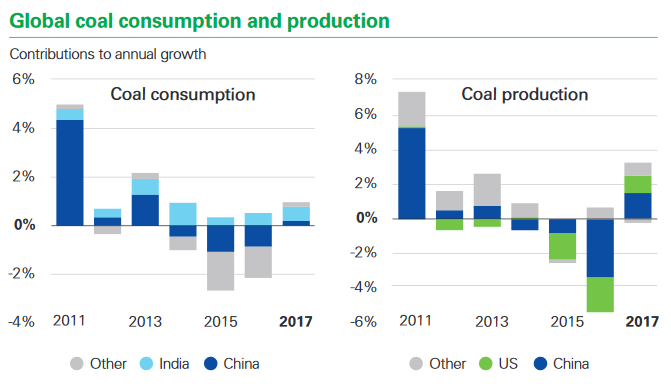 Source: BP (2018), Statistical Review of World Energy
While wind and solar together represent about 8% of the global power fuel mix, they represent only about 4% of the global total fuel mix. This difference is due to the fact that renewables exclusively generate electricity — the transportation sector relies on petroleum products. Oil demand increased by around 1.7 million barrels/day last year and is likely to be similar during 2018, compared to the 10-year average growth of 1.1 million barrels/day annually. This again was mostly driven by developing countries, seen below by the graph of oil consumption by region. The world consumes around 100 million barrels of oil/day presently, and under very conservative scenarios, that might decline to 80 million barrels/day by 2040, while business-as-usual scenarios predict around 110 millions barrels/day by 2040.
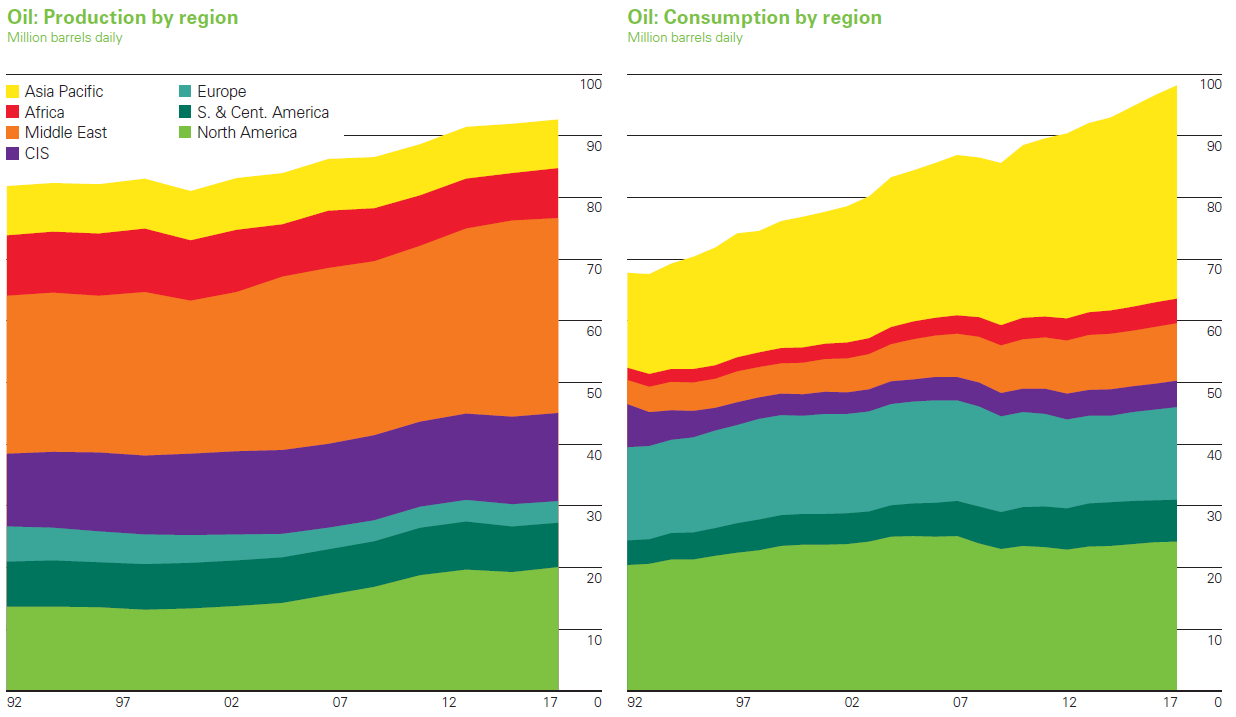 Source: BP (2018), Statistical Review of World Energy
One appealing alternative to petroleum-burning cars is electric vehicles (EVs). BP predicts that the number of EVs worldwide will increase from three million today to over one billion by 2040. However, it is important to consider what EVs might change and what they might not. While reaching one billion EVs by 2040 would significantly reduce local ambient air pollution in urban areas, it is unlikely to influence either oil demand or carbon emissions dramatically. This can seem counter-intuitive at first.
Of the 100 million barrels of oil/day currently consumed, only about 20 million barrels/day is used to power cars. In a world experiencing continued economic growth, the number of trucks, planes, and cargo ships continues to increase, it would be reasonable to predict three or four million barrels/day less annual growth between now and 2040. This would bring the total volume displaced by EVs to about 10 million barrels/day in 2040 less than would have been consumed under a business -as-usual scenario. In terms of carbon emissions, even if it is assumed that all one billion EVs are charged using exclusively carbon-free electricity, that 10 million barrels/day by 2040 less oil consumption works out to a meager 3% reduction in carbon emissions by 2040 — for context: meeting the Paris Agreement’s goal of preventing an increase of 2°C above pre-industrial temperatures will require a 50% reduction in carbon emissions from today’s levels by 2040.
If EVs will not get us to the carbon reductions necessary to prevent 2°C of warming, where should effort be made? The answer is the power sector. Firstly, the power sector is the largest sector in terms of of both primary energy consumption and carbon emissions, so any changes there have disproportionately large effects. It is also relatively easier to make changes in the power sector, since it is responsive to relative fuel pricing. For example, it is incredibly rare to see utilities companies building new coal-fired power plants in the USA today, since technological breakthroughs in horizontal oil drilling (“fracking”) have brought the price of natural gas below the price of coal. The enactment of a carbon pricing mechanism would tip the scales even further toward natural gas and renewables. Transportation, by contrast, is bound to just one fuel.
This is not to say that there should not be effort to reduce carbon emissions in transportation. Currently, the most carbon-intensive forms of transportation have little or no regulation. Over 45 countries have fuel efficiency standards for passenger vehicles, while only four have any for semi trucks, and the shipping industry, which uses one of the cheapest, dirtiest crude oil derivatives, was completely excluded from the Paris Agreement. Clearly much progress can be made, and the sheer scale of climate change requires contributions wherever possible. However, power remains the sector with the most potential to make a difference in mitigating climate change, and the one where it is most economically efficient to do so, thus requiring the least investment and political will. This makes the lack of progress in the power sector over the last 20 years especially worrying.
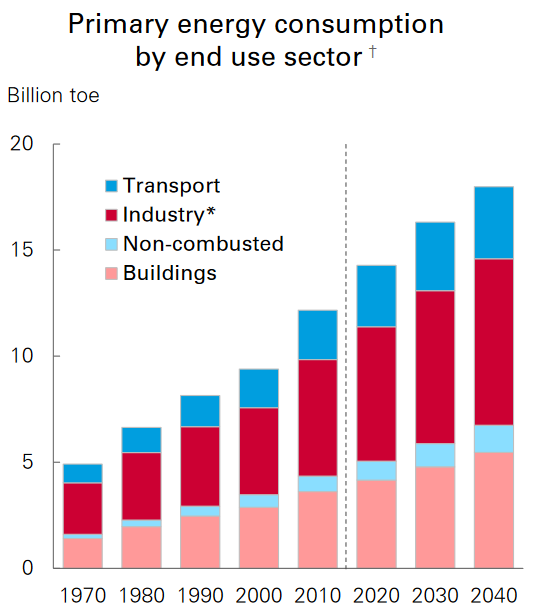
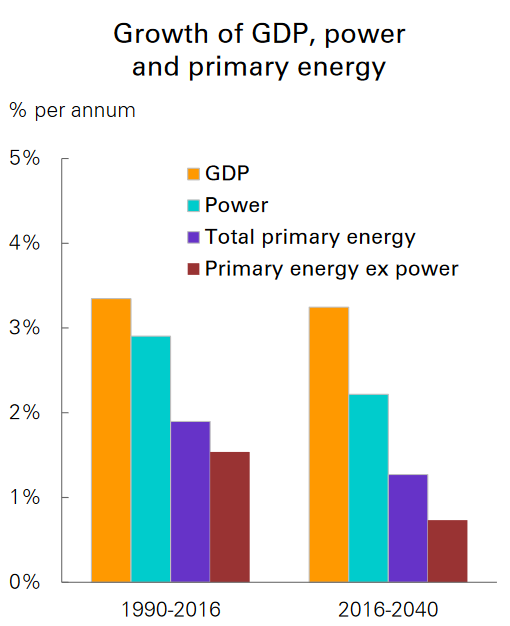
Note that power and transportation are not the only energy-consuming sectors. However, they receive most of the focus both because they are the largest-consuming sectors of primary energy, and because they are the only two that consume solely primary energy. The industrial sector is the third largest-consuming sector after transportation. For primary energy sources, it consumes coal, natural gas, and crude oil to be refined (“non-combusted” energy, first graph below). It also consumes fertilizer derived from natural gas, steam for process heating, electric power to operate machinery, and petroleum products via the transportation of intermediate goods. The residential sector (“buildings,” first graph below) comes in last in terms of energy consumption. For primary energy sources, it consumes petroleum products, coal, and biomass for heating, as well as petroleum products and biomass for cooking. The residential sector also consumes steam and electric power as secondary energy sources. Over time, it is expected that electricity will provide a greater share of total energy consumed, which is displayed by the second graph below.
Source: BP (2018), Energy Outlook
Source: BP (2018), Energy Outlook
Lastly, given the strong growth in renwables and EVs, many are starting to think about the backward linkages and policy implications related to the materials necessary for these technologies. These materials include cobalt and lithium which are used in batteries for EVs and grid-scale electricity storage, silicon which is used in many solar panels, and rare earth metals which are used in magnets for wind turbines. The 2018 Statistical Review included for the first time a section titled “Key Materials for the Changing Energy World” that covered this topic, but a more comprehensive primer was written in January 2018 by Morgan Bazilian.